- JDK 23対応 GraalVM (最新版)
- JDK 24対応 GraalVM (早期アクセス)
- JDK 21対応 GraalVM
- JDK 17対応 GraalVM
- アーカイブ
- 開発ビルド
プロファイリング コマンドライン ツール
GraalVM **プロファイリング コマンドライン ツール**は、CPUとメモリの使用状況を分析することで、コードの最適化を支援します。
ほとんどのアプリケーションは、実行時間の80%をコードの20%で費やします。そのため、コードを最適化するには、アプリケーションがどこで時間を使っているかを知ることが不可欠です。このセクションでは、サンプルアプリケーションを使用して、GraalVMが提供する3つの主要なプロファイリング機能、CPU Tracer、CPU Sampler、Memory Tracerを紹介します。
このサンプルアプリケーションは、エラトステネスの篩アルゴリズムに基づく基本的な素数計算機を使用します。
-
次のコードを `primes.js` という名前の新しいファイルにコピーします。
class AcceptFilter { accept(n) { return true } } class DivisibleByFilter { constructor(number, next) { this.number = number; this.next = next; } accept(n) { var filter = this; while (filter != null) { if (n % filter.number === 0) { return false; } filter = filter.next; } return true; } } class Primes { constructor() { this.number = 2; this.filter = new AcceptFilter(); } next() { while (!this.filter.accept(this.number)) { this.number++; } this.filter = new DivisibleByFilter(this.number, this.filter); return this.number; } } var primes = new Primes(); var primesArray = []; for (let i = 0; i < 5000; i++) { primesArray.push(primes.next()); } console.log(`Computed ${primesArray.length} prime numbers. ` + `The last 5 are ${primesArray.slice(-5)}.`); - `js primes.js` を実行します。サンプルアプリケーションは次のように出力するはずです。
 js primes.js
 Computed 5000 prime numbers. The last 5 are 48563,48571,48589,48593,48611.
このプログラムは計算に少し時間がかかります。次に、時間がどこで費やされているかを確認します。
- `js --cpusampler primes.js` を実行して、CPUサンプリングを有効にします。CPU Sampler は、サンプルアプリケーションの出力を次のように表示するはずです。
 js --cpusampler primes.js

 Computed 5000 prime numbers. The last 5 are 48563,48571,48589,48593,48611.
 ----------------------------------------------------------------------------------------------
 Sampling Histogram. Recorded 250 samples with period 10ms.
   Self Time: Time spent on the top of the stack.
   Total Time: Time spent somewhere on the stack.
 ----------------------------------------------------------------------------------------------
 Thread[main,5,main]
  Name       ||             Total Time    ||              Self Time    || Location
 ----------------------------------------------------------------------------------------------
  accept     ||             2150ms  86.0% ||             2150ms  86.0% || primes.js~13-22:191-419
  next       ||             2470ms  98.8% ||              320ms  12.8% || primes.js~31-37:537-737
  :program   ||             2500ms 100.0% ||               30ms   1.2% || primes.js~1-46:0-982
 ----------------------------------------------------------------------------------------------
デフォルトでは、サンプラーは各JavaScript関数の`実行時間ヒストグラム`を出力します。
`--cpusampler=flamegraph` オプションを使用して、SVG形式のフレームグラフを生成できます。
js --cpusampler=flamegraph primes.jsこれにより、次のような内容を含む `flamegraph.svg` というファイルが生成されます。
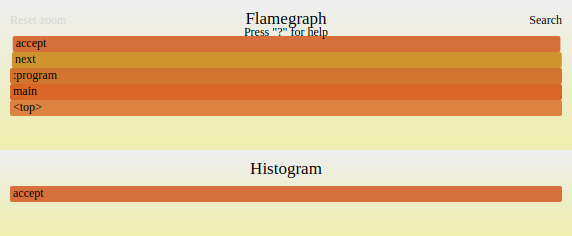
要素をクリックすることで、グラフを拡大できます。
デフォルトでは、CPUサンプリングは10ミリ秒ごとにサンプルを取得します。結果から、時間の約89%が `DivisibleByFilter.accept` 関数で費やされていることがわかります。
accept(n) { var filter = this; while (filter != null) { if (n % filter.number === 0) { return false; } filter = filter.next; } return true; }詳細は、このブログ記事をご覧ください。
次に、CPU Tracerを使用して、各ステートメントの実行回数を収集します。
- `js primes.js --cputracer --cputracer.TraceStatements --cputracer.FilterRootName=*accept` を実行して、`accept` で終わるメソッドのすべてのステートメントの実行回数を収集します。
 js primes.js --cputracer --cputracer.TraceStatements --cputracer.FilterRootName=accept
 Computed 5000 prime numbers. The last 5 are 48563,48571,48589,48593,48611.
 -----------------------------------------------------------------------------------------
 Tracing Histogram. Counted a total of 468336895 element executions.
   Total Count: Number of times the element was executed and percentage of total executions.
   Interpreted Count: Number of times the element was interpreted and percentage of total executions of this element.
   Compiled Count: Number of times the compiled element was executed and percentage of total executions of this element.
 -----------------------------------------------------------------------------------------
  Name     |          Total Count |    Interpreted Count |       Compiled Count | Location
 -----------------------------------------------------------------------------------------
  accept   |     234117338  50.0% |        365660   0.2% |     233751678  99.8% | primes.js~15:245-258
  accept   |     117053670  25.0% |        182582   0.2% |     116871088  99.8% | primes.js~16-18:275-348
  accept   |     117005061  25.0% |        181001   0.2% |     116824060  99.8% | primes.js~19:362-381
  accept   |         53608   0.0% |          1829   3.4% |         51779  96.6% | primes.js~14:211-227
  accept   |         53608   0.0% |          1829   3.4% |         51779  96.6% | primes.js~13-22:191-419
  accept   |         48609   0.0% |          1581   3.3% |         47028  96.7% | primes.js~17:322-334
  accept   |          4999   0.0% |           248   5.0% |          4751  95.0% | primes.js~21:402-413
  accept   |             1   0.0% |             1 100.0% |             0   0.0% | primes.js~2-4:25-61
  accept   |             1   0.0% |             1 100.0% |             0   0.0% | primes.js~3:45-55
 -----------------------------------------------------------------------------------------
出力には、タイミング情報ではなく、各ステートメントの実行カウンターが表示されます。トレースヒストグラムは、最適化が必要なアルゴリズムの動作に関する洞察を提供することがよくあります。
- `js primes.js --experimental-options --memtracer` を実行して、報告された割り当てのソースコードの場所と回数を表示します。割り当てをキャプチャするためのMemory Tracerツールは、現在GraalVMの試験的な機能です。そのため、`--memtracer` の前には、コマンドラインオプション `--experimental-options` を付ける必要があります。
 js primes.js --experimental-options --memtracer
 Computed 5000 prime numbers. The last 5 are 48563,48571,48589,48593,48611.
 ------------------------------------------------------------
 Location Histogram with Allocation Counts. Recorded a total of 5007 allocations.
   Total Count: Number of allocations during the execution of this element.
   Self Count: Number of allocations in this element alone (excluding sub calls).
--------------------------------------------------------
 Name     |      Self Count |     Total Count | Location
--------------------------------------------------------
 next     |     5000  99.9% |     5000  99.9% | primes.js~31-37:537-737
 :program |        6   0.1% |     5007 100.0% | primes.js~1-46:0-982
 Primes   |        1   0.0% |        1   0.0% | primes.js~25-38:424-739
--------------------------------------------------------
この出力は、関数ごとに記録された割り当ての数を示しています。計算された各素数について、プログラムは `next` に1つのオブジェクトと `DivisibleByFilter` の `constructor` に1つのオブジェクトを割り当てます。割り当ては、コンパイラによって削除されるかどうかに関係なく記録されます。
GraalVMコンパイラは、割り当ての最適化に特に優れており、実行パフォーマンスを向上させるために、割り当てを頻度の低いブランチにプッシュできます。GraalVMチームは、将来、メモリ最適化に関する情報をメモリトレーサーに追加する予定です。
ツールオプション #
すべてのゲスト言語ランチャーで `--help:tools` オプションを使用して、CPU Sampler、CPU Tracer、Memory Tracerのリファレンス情報を表示します。現在使用可能なオプションのセットは次のとおりです。
CPU Sampler オプション #
- `--cpusampler=true|false|<Output>`:CPUサンプラーを有効/無効にするか、Outputオプションで指定された特定の出力で有効にします(デフォルト:false)。このオプションで出力を選択すると、flamegraphを除き、デフォルトで標準出力に出力されます。flamegraphはflamegraph.svgファイルに出力されます。
- `--cpusampler.Delay=<ms>`:サンプリングを指定されたミリ秒数だけ遅延させます(デフォルト:0)。
- `--cpusampler.FilterFile=<filter>`:ソースファイルパスのワイルドカードフィルター。(例:_program_.sl)(デフォルト:フィルターなし)。
- `--cpusampler.FilterLanguage=<languageId>`:指定されたIDの言語のみをプロファイルします。(例:js)(デフォルト:すべてプロファイル)。
- `--cpusampler.FilterMimeType=<mime-type>`:指定されたMIMEタイプの言語のみをプロファイルします。(例:application/javascript)(デフォルト:すべてプロファイル)
- `--cpusampler.FilterRootName=<filter>`:プログラムルートのワイルドカードフィルター。(例:Math.*)(デフォルト:フィルターなし)。
- `--cpusampler.GatherAsyncStackTrace=true|false`:各サンプルの非同期スタックトレース要素を収集しようとします(デフォルト:true)。このオプションを無効にすると、サンプリングのオーバーヘッドが軽減される場合があります。
- `--cpusampler.GatherHitTimes`:取得した各サンプルのタイムスタンプを保存します。
- `--cpusampler.MinSamples=[0, inf)`:サンプル数がこの値未満の要素を出力から削除します(デフォルト:0)
- `--cpusampler.Output=histogram|calltree|json|flamegraph`:出力形式をhistogram、calltree、json、またはflamegraphのいずれかに指定します(デフォルト:histogram)。
- `--cpusampler.OutputFile=<path>`:出力を指定されたファイルに保存します。デフォルトでは、出力は出力ストリームに出力されます。
- `--cpusampler.Period=<ms>`:スタックをサンプリングする周期(ミリ秒)(デフォルト:10)
- `--cpusampler.SampleContextInitialization`:コンテキストの初期化中に実行されたコードのサンプリングを有効にします
- `--cpusampler.ShowTiers=true|false|0,1,2`:エントリのコンパイル情報を表示するかどうかを指定します。「true」を指定するとすべてのコンパイル情報が表示され、「false」を指定すると何も表示されません。コンパイル層のカンマ区切りリストを指定することもできます。注:インタープリターはTier 0と見なされます。(デフォルト:false)
- `--cpusampler.StackLimit=[1, inf)`:最大スタック要素の最大数(デフォルト:10000)。
- `--cpusampler.SummariseThreads`:すべての「スレッドごと」のプロファイルのサマリーとして出力を出力します。
CPU Tracer オプション #
- `--cputracer`:CPUトレーサーを有効にします(デフォルト:false)。
- `--cputracer.FilterFile=<filter>`:ソースファイルパスのワイルドカードフィルター。(例:_program_.sl)(デフォルト:フィルターなし)。
- `--cputracer.FilterLanguage=<languageId>`:指定されたIDの言語のみをプロファイルします。(例:js)(デフォルト:フィルターなし)。
- `--cputracer.FilterMimeType=<mime-type>`:MIMEタイプの言語のみをプロファイルします。(例:application/javascript)(デフォルト:フィルターなし)。
- `--cputracer.FilterRootName=<filter>`:プログラムルートのワイルドカードフィルター。(例:Math.*)(デフォルト:フィルターなし)。
- `--cputracer.Output=histogram|json`:「histogram」または「json」を出力として出力します(デフォルト:histogram)。
- `--cputracer.OutputFile=<path>`:出力を指定されたファイルに保存します。デフォルトでは、出力は標準出力ストリームに出力されます。
- `--cputracer.TraceCalls`:トレース時に呼び出しをキャプチャします(デフォルト:false)。
- `--cputracer.TraceRoots=true|false`:トレース時にルートをキャプチャします(デフォルト:true)。
- `--cputracer.TraceStatements`:トレース時にステートメントをキャプチャします(デフォルト:false)。
Memory Tracer オプション #
メモリトレーサーツールは、現在試験的なツールです。`--memtracer` を有効にするには、`--experimental-options` フラグを前に付けてください。
- `--memtracer`:メモリトレーサーを有効にします(デフォルト:false)。
- `--memtracer.FilterFile=<filter>`:ソースファイルパスのワイルドカードフィルター。(例:_program_.sl)(デフォルト:フィルターなし)。
- `--memtracer.FilterLanguage=<languageId>`:指定されたIDの言語のみをプロファイルします。(例:js)(デフォルト:フィルターなし)。
- `--memtracer.FilterMimeType=<mime-type>`:MIMEタイプの言語のみをプロファイルします。(例:application/javascript)。(デフォルト:フィルターなし)
- `--memtracer.FilterRootName=<filter>`:プログラムルートのワイルドカードフィルター。(例:Math.*)(デフォルト:フィルターなし)。
- `--memtracer.Output=typehistogram|histogram|calltree`:「typehistogram」、「histogram」、または「calltree」を出力として出力します。(デフォルト:histogram)
- `--memtracer.StackLimit=[1, inf)`:最大スタック要素の最大数。(デフォルト:10000)
- `--memtracer.TraceCalls`:トレース時に呼び出しをキャプチャします。(デフォルト:false)
- `--memtracer.TraceRoots=true|false`:トレース時にルートをキャプチャします。(デフォルト:true)
- `--memtracer.TraceStatements`:トレース時にステートメントをキャプチャします(デフォルト:false)。